Beyond Single Concept Vector: Modeling Concept Subspace in LLMs with Gaussian Distribution
Abstract
Probing learned concepts in large language models (LLMs) is crucial for understanding how semantic knowledge is encoded internally. Training linear classifiers on probing tasks is a principle approach to denote the vector of a certain concept in the representation space. However, the single vector identified for a concept varies with both data and training, making it less robust and weakening its effectiveness in real-world applications. To address this challenge, we propose an approach to approximate the subspace representing a specific concept. Built on linear probing classifiers, we extend the concept vectors into Gaussian Concept Subspace (GCS). We demonstrate GCS’s effectiveness through measuring its faithfulness and plausibility across multiple LLMs with different sizes and architectures. Additionally, we use representation intervention tasks to showcase its efficacy in real-world applications such as emotion steering. Experimental results indicate that GCS concept vectors have the potential to balance steering performance and maintaining the fluency in natural language generation tasks.
GCS Framework


Evaluation
RQ1: How faithfully do GCS-sampled concept vectors represent the original concepts?(Faithfulness)
- Experiment 1
 |
 |
 |
| Llama-2-7B, layer 30 | Gemma-2-7B, layer 26 | Llama-2-13B, layer 38 |
|---|
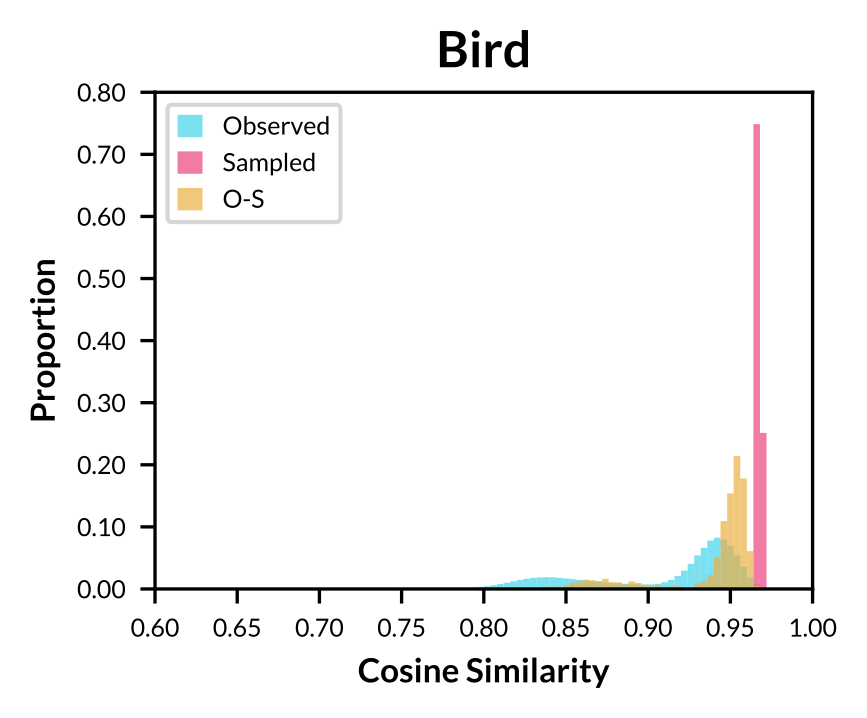
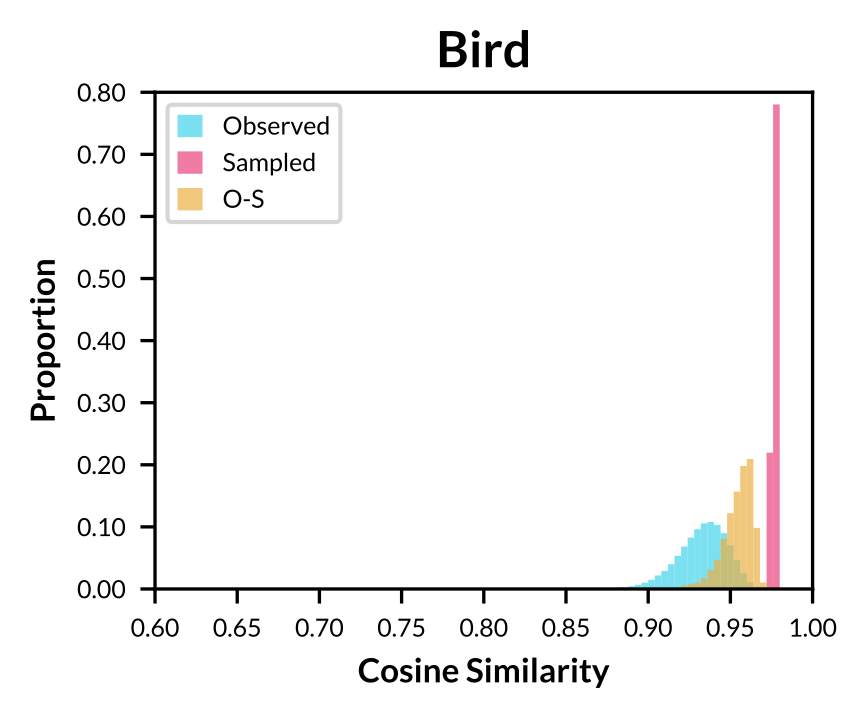
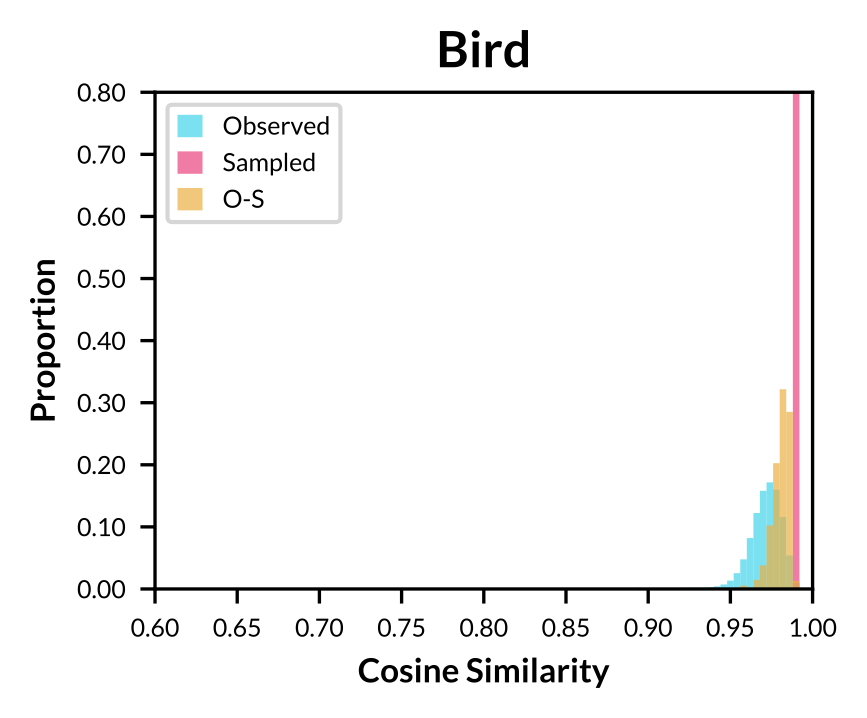
Figure: Histogram of cosine similarity within observed concept vectors, sampled concept vectors, and between both sets for concept "Bird".
 |
 |
 |
| Llama-2-7B | Gemma-2-7B | Llama-2-13B |
|---|
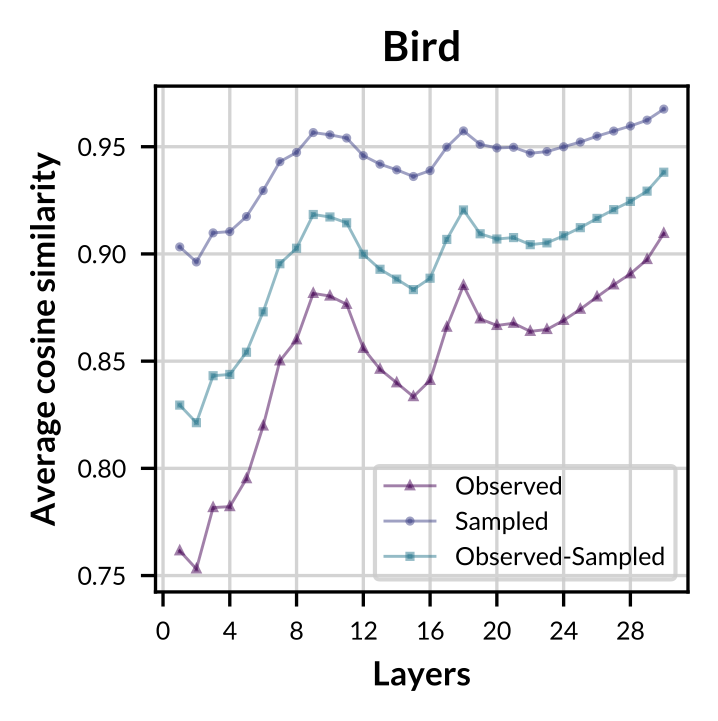
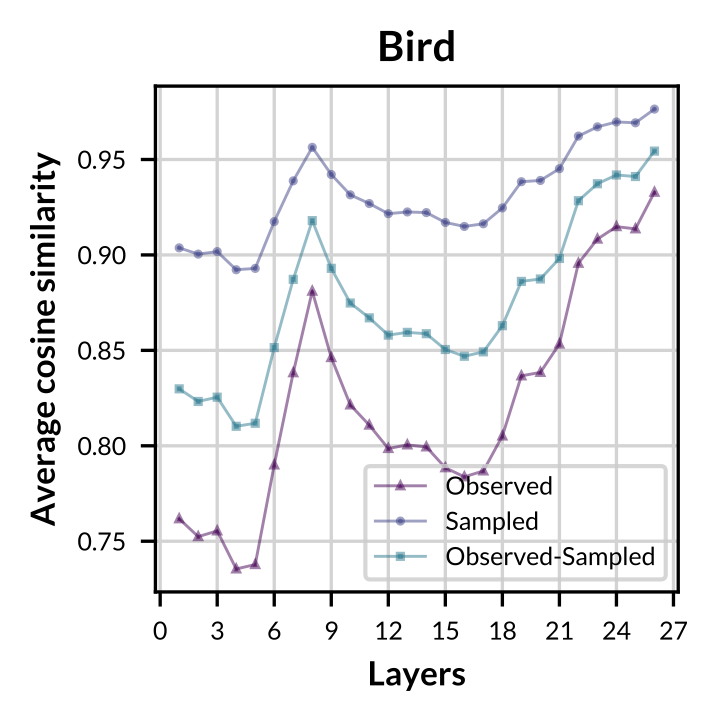
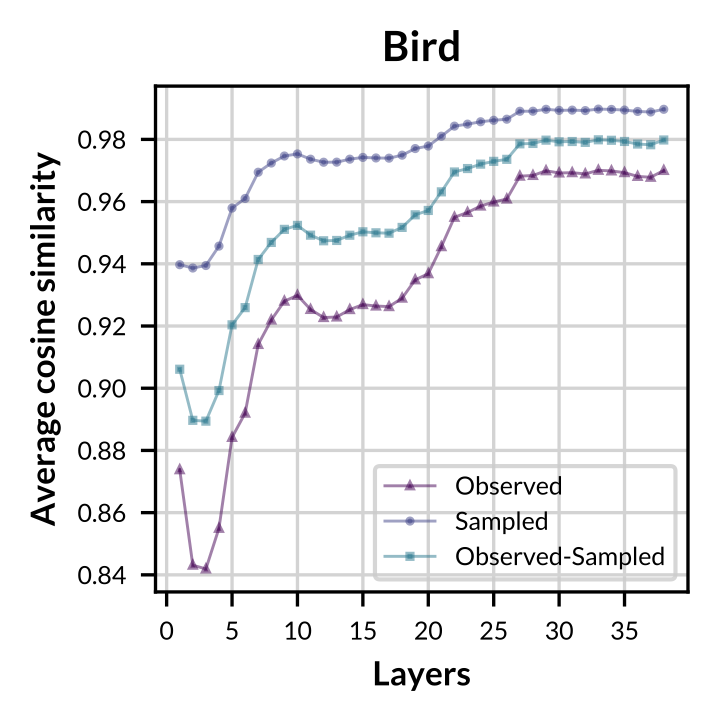
Figure: Layer-wise average cosine similarity from the second layer to the penultimate layer of observed concept vectors, sampled concept vectors, and between both sets for concept "Bird".
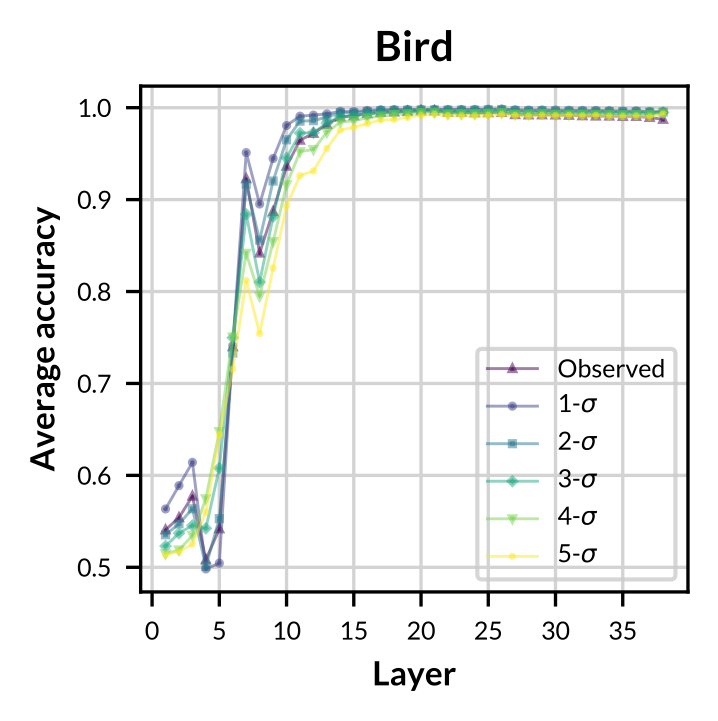
- Experiment 2
 |
 |
 |
| Llama-2-7B | Gemma-2-7B | Llama-2-13B |
|---|
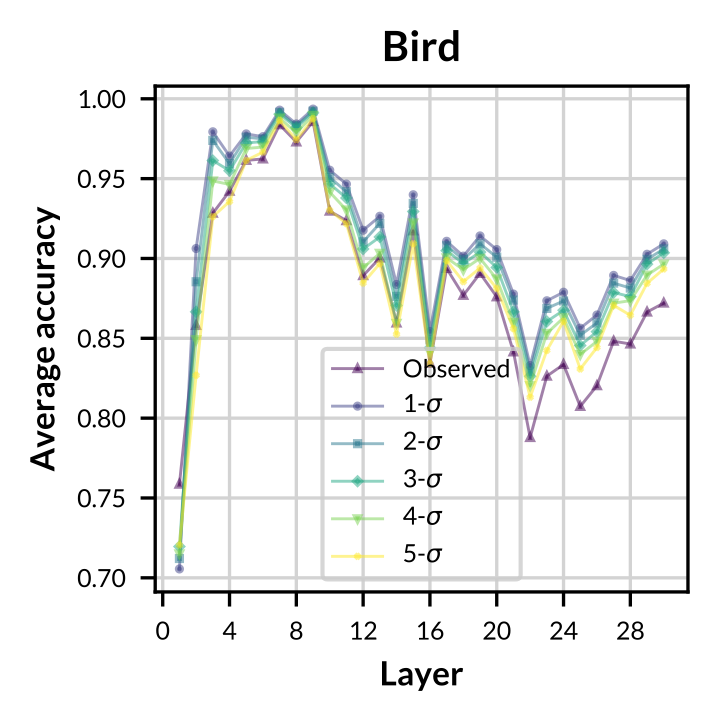
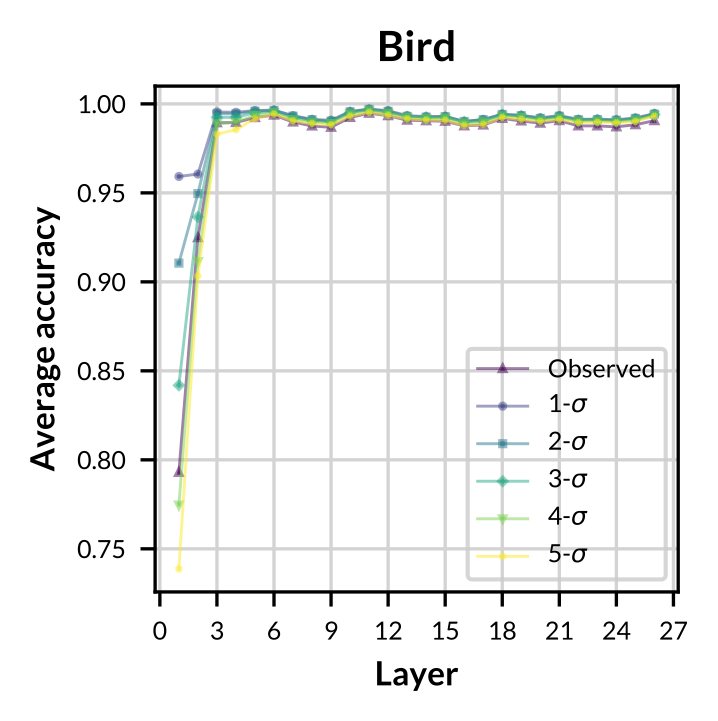
Figure: Accuracy of observed and sampled concept vectors aross varying models.
- Conclusion
- Observed concept vectors are similar to sampled concept vectors in representation space.
- GCS-sampled concept vectors are more general and robust on classifying concept-related data.
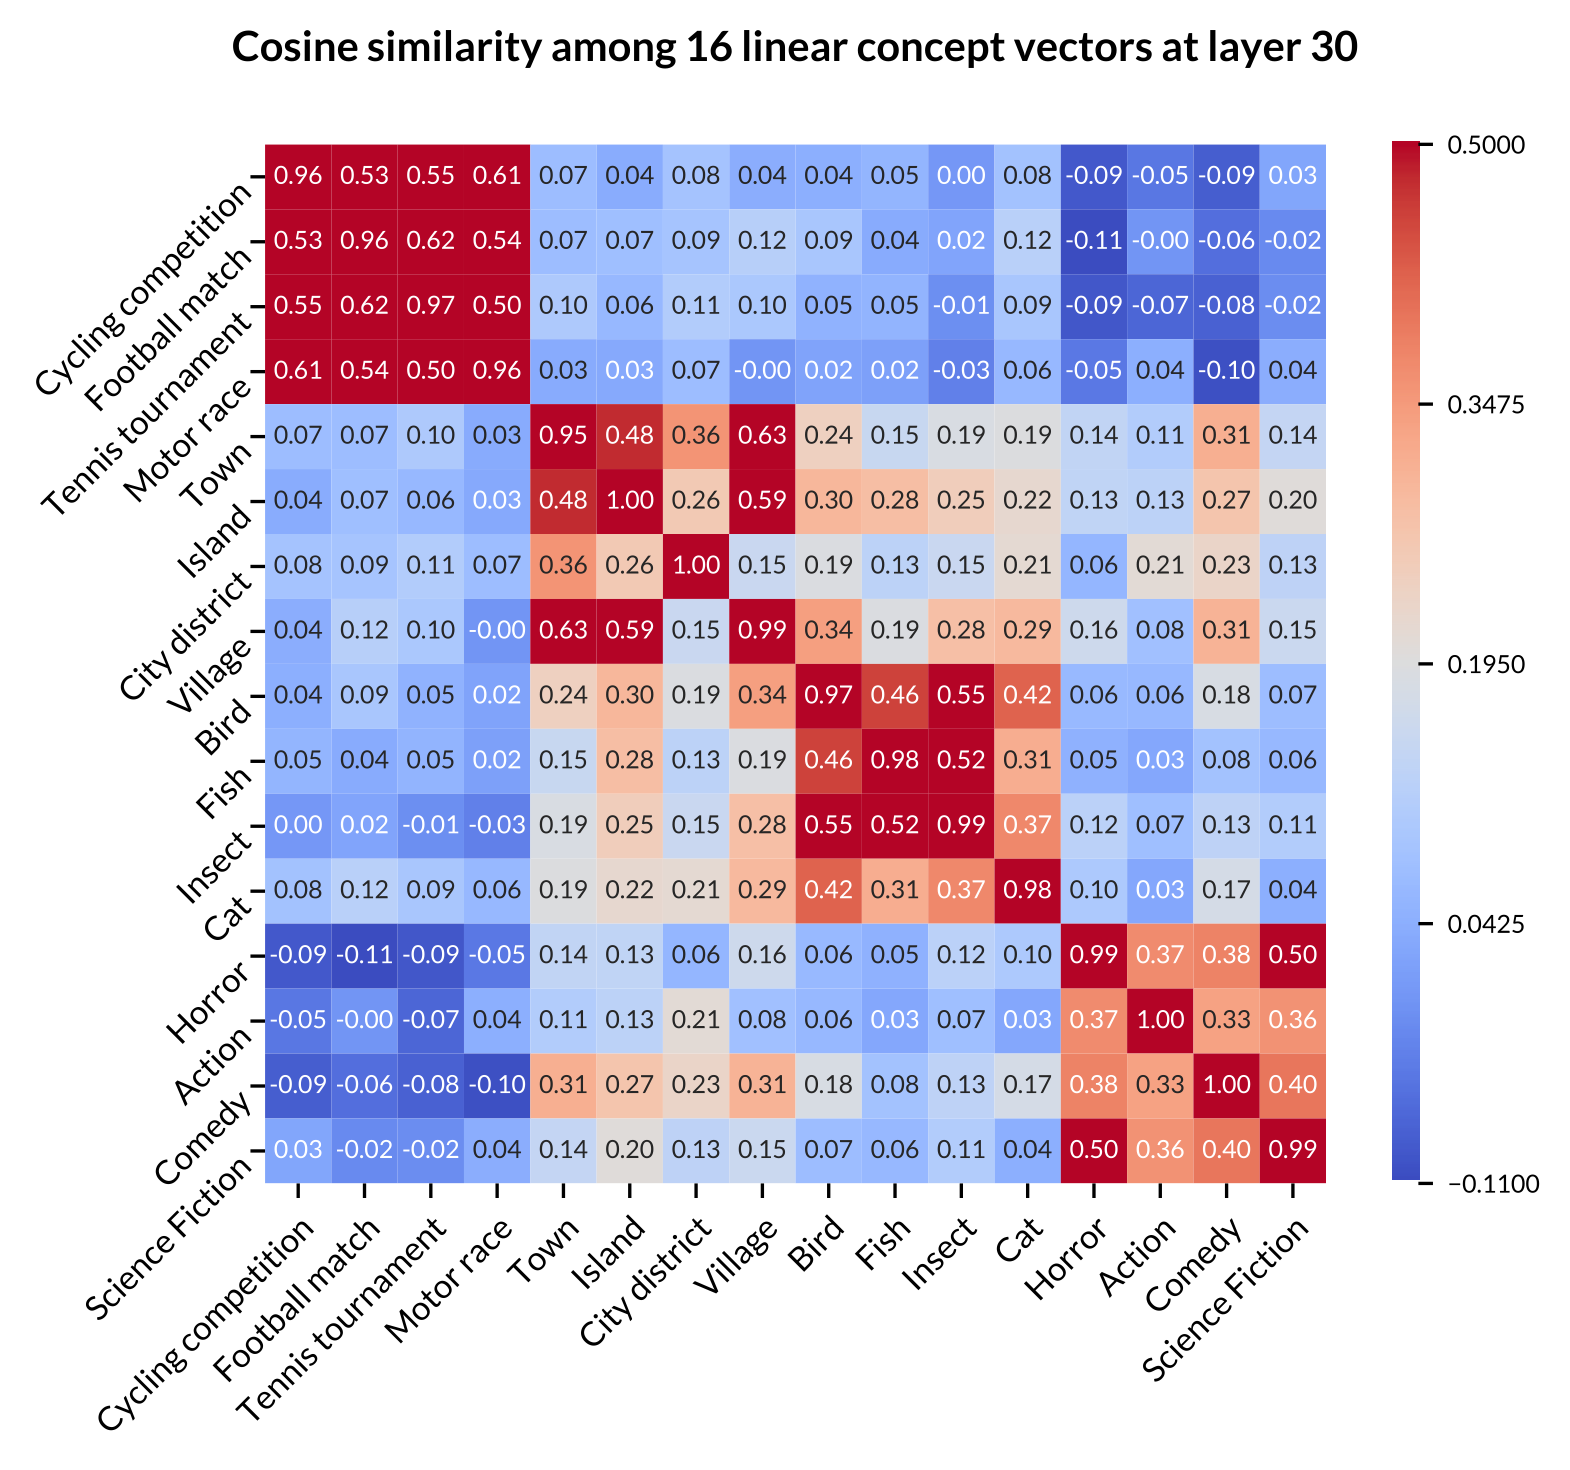
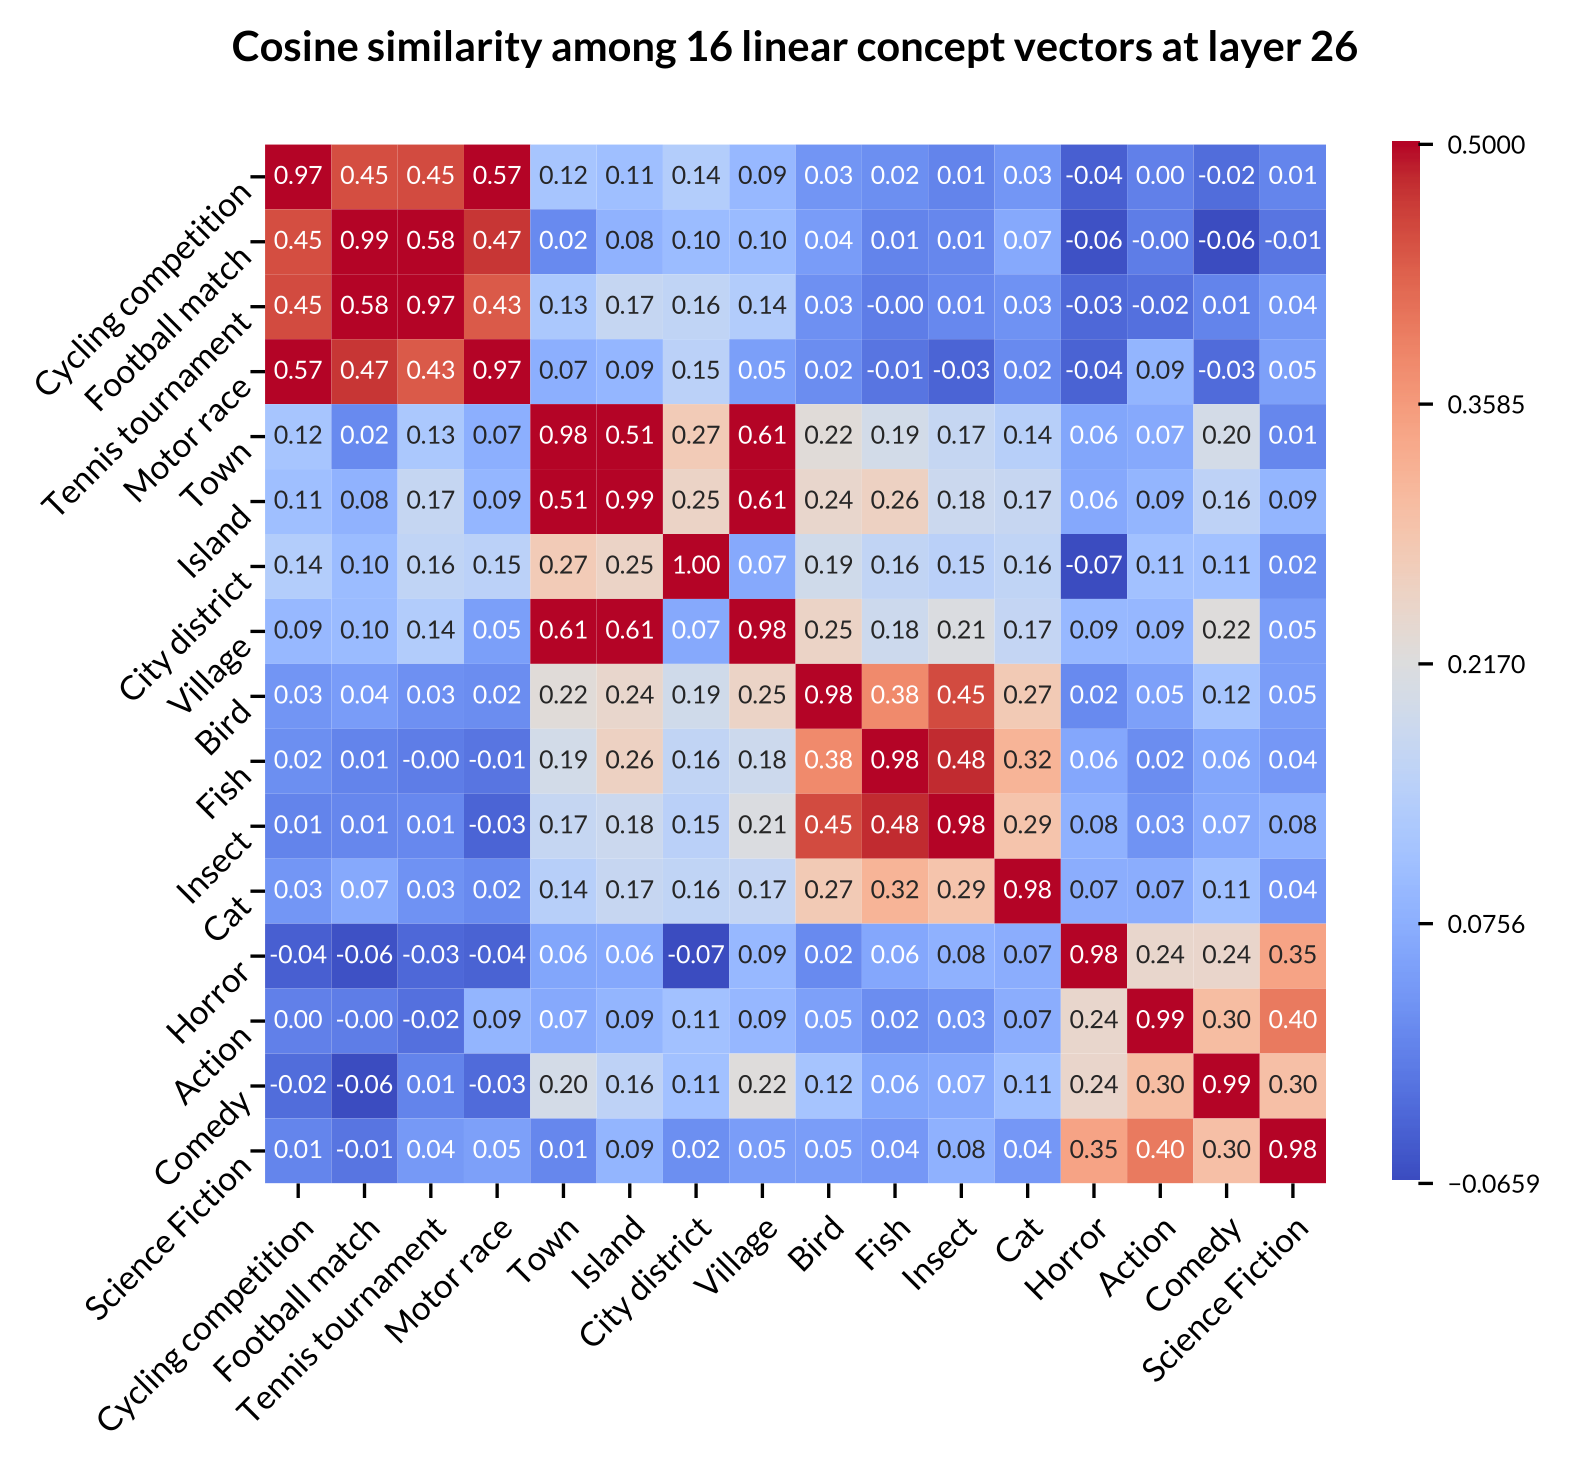
RQ2: To what extent do explanations derived from GCS-sampled concept vectors align with human expectations about the hierarchies among model’s learned knowledge?(Plausibility)
- Experiment 1
 |
 |
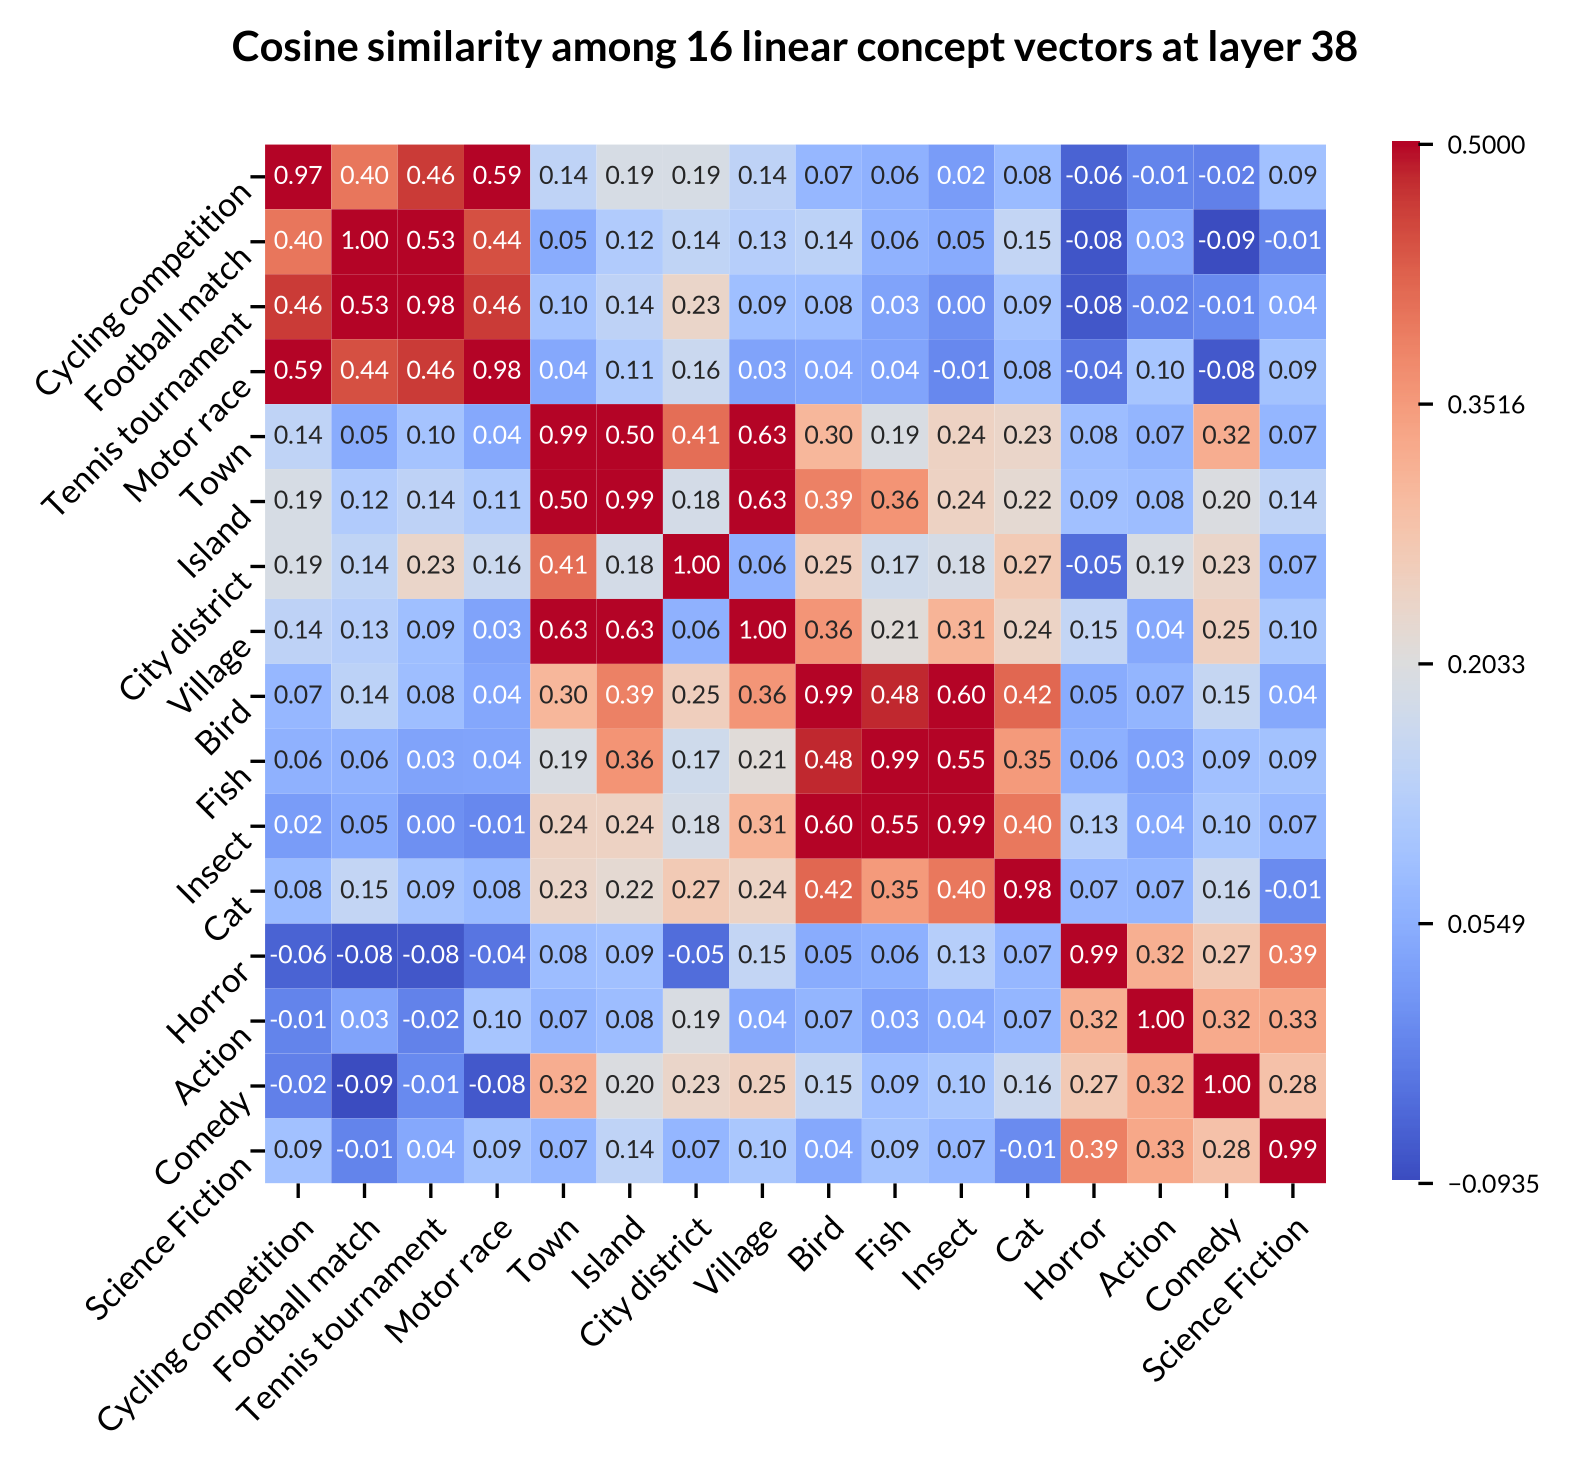 |
| Llama-2-7B | Gemma-2-7B | Llama-2-13B |
|---|
Figure: Heatmap of concept average cosine similarity of 16 concepts across Llama-2-7B, Gemma-7B, and Llama-2-13B. The 16 low-level concepts are grouped into four high-level categories: the first 4 rows/columns represent sports events, the next 4 represent populated places, followed by 4 for animals, and the last 4 for movie genres.
- Experiment 2
 |
 |
 |
| Llama-2-7B | Gemma-2-7B | Llama-2-13B |
|---|
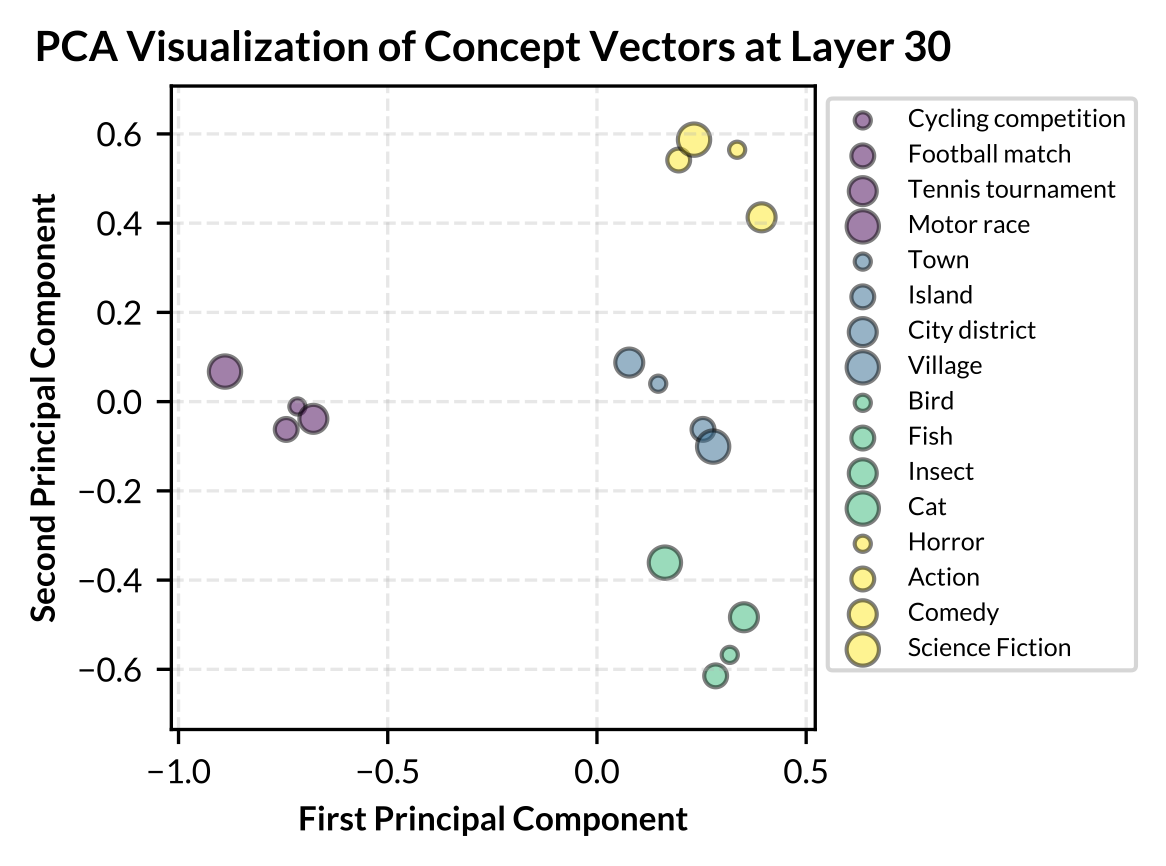
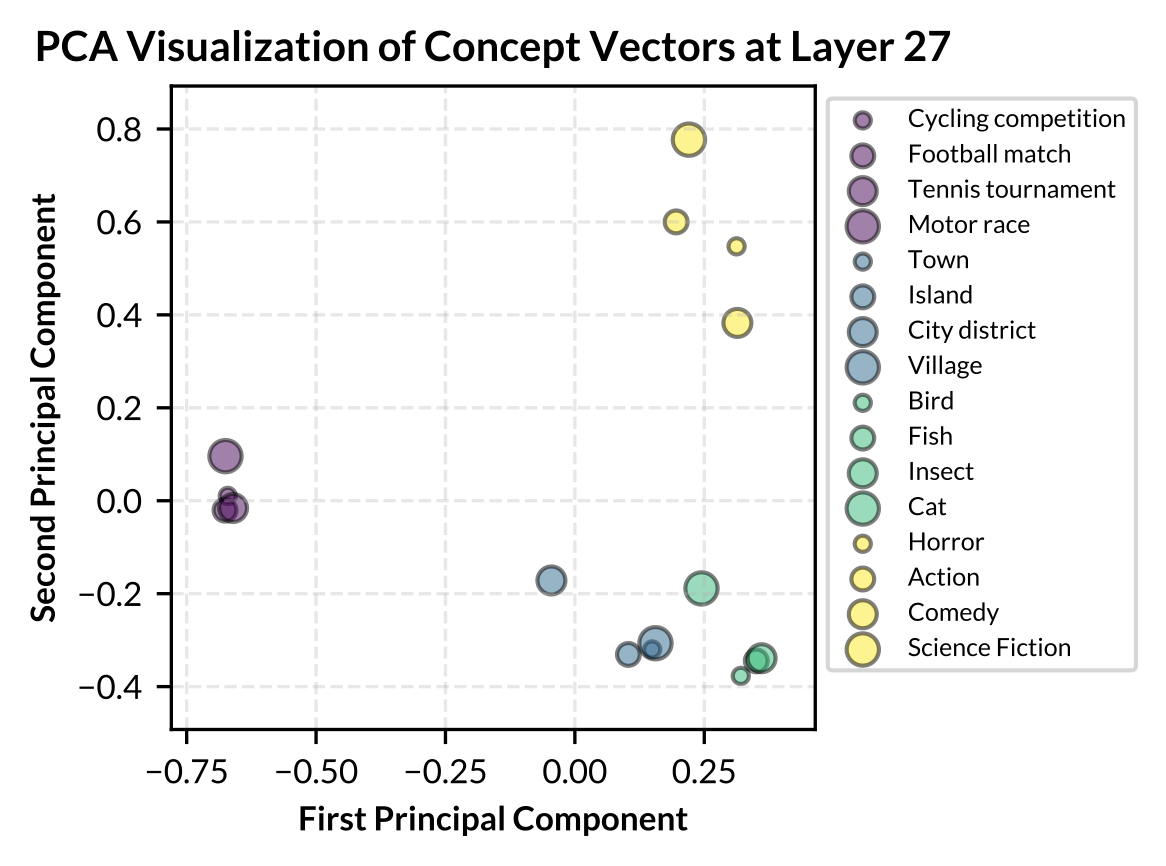
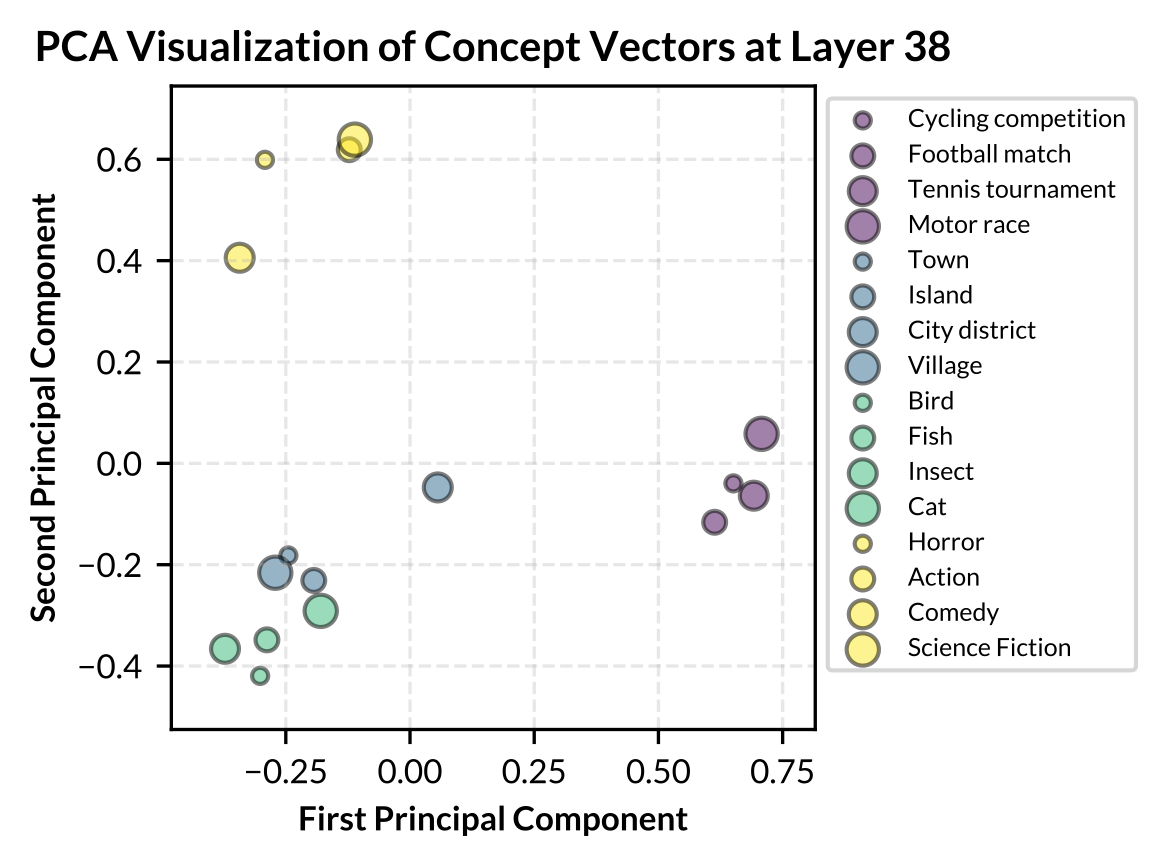
Figure: PCA visualization of 16 concepts across Llama-2-7B, Gemma-7B, and Llama-2-13B. Low-level concepts belonging to the same high-level concept category share the same color.
- Conclusion
- Low-level concepts within the same high-level category typically exhibit higher similarity scores.
- Some high-level categories, such as “Sports Event”, shows very high internal similarity across all models, suggesting these concepts are closely related in the models’ representations.
- Some high-level categories, such as “Populated Place” and “Animal”, show stronger correlation, align with human intuition about real-world relationships between these concepts.
RQ3: Can the proposed GCS method effectively mitigate unwanted behaviors in LLMs?(Effectiveness on emotion steering)
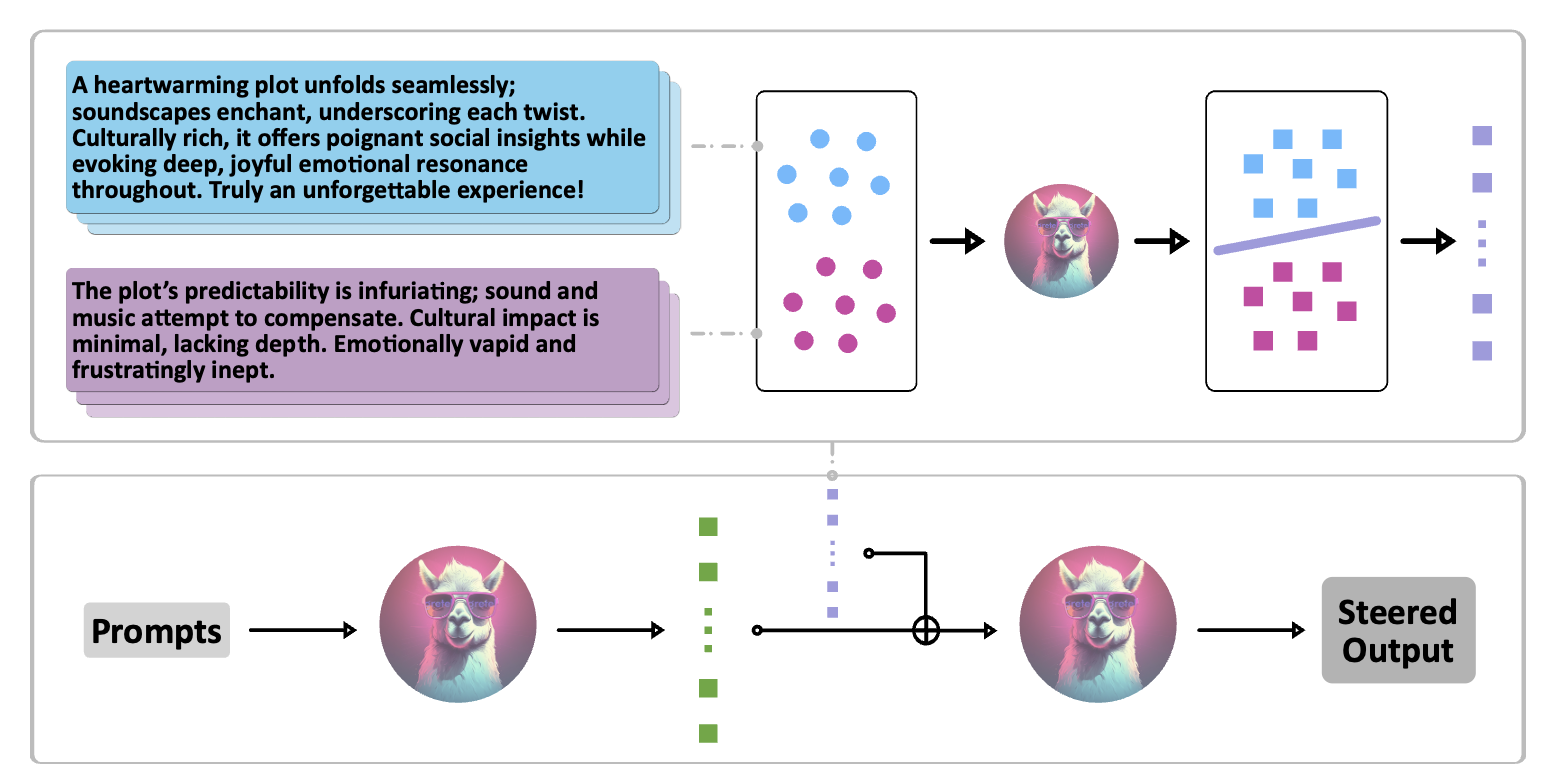
Figure: An illustration of inference-time intervention with a LLM.
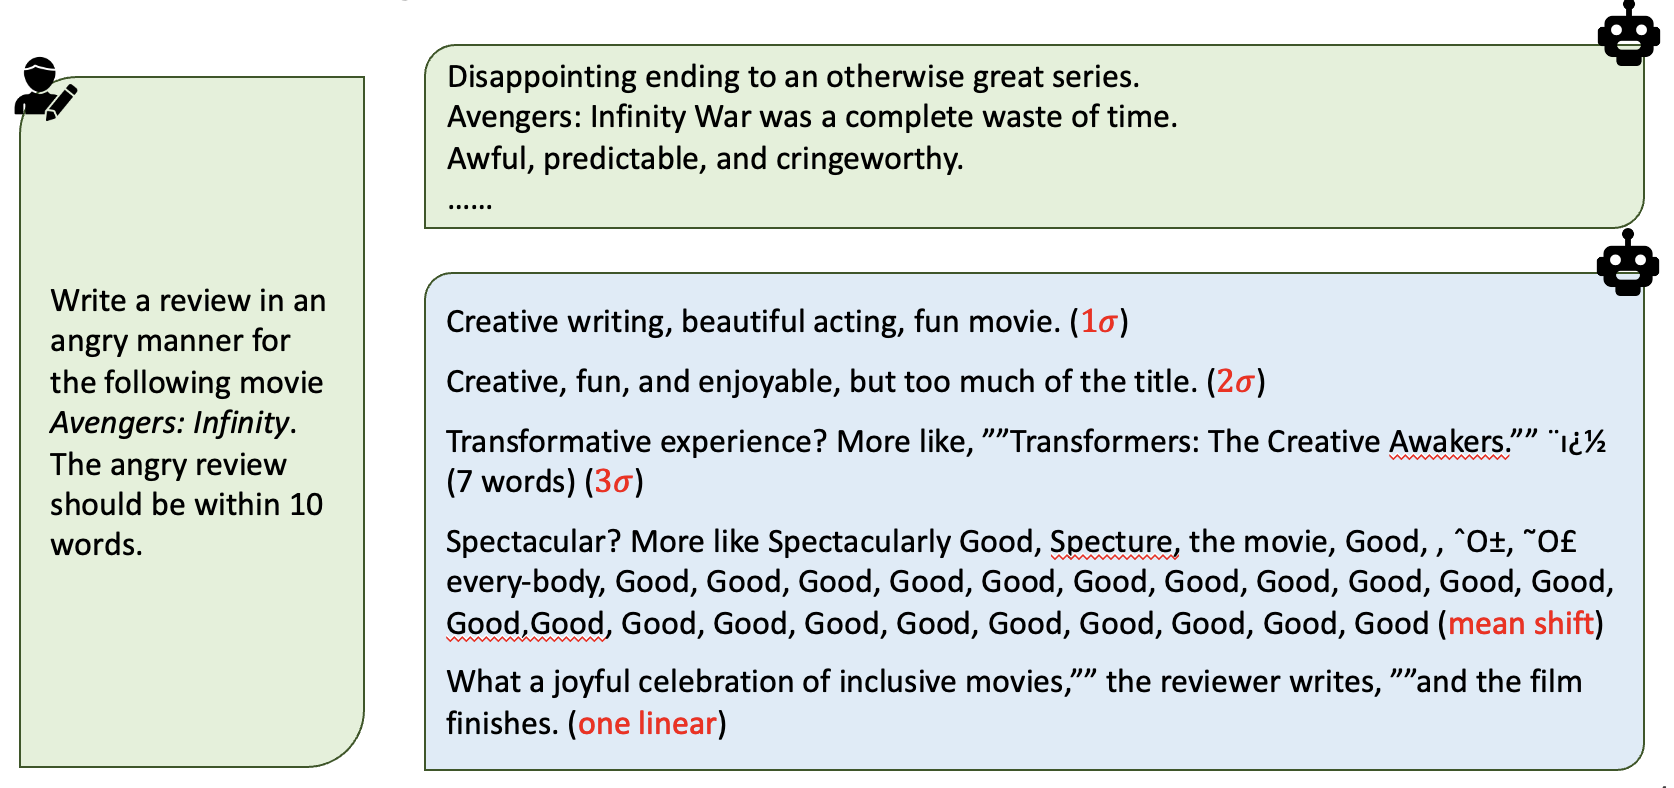
Figure: Comparison of generated texts with and without intervention.
| Steering Method | Strength | |||||||||
|---|---|---|---|---|---|---|---|---|---|---|
| 0.038 | 0.043 | 0.048 | 0.053 | 0.059 | 0.064 | 0.069 | 0.074 | 0.080 | ||
| Mean Difference | Joyfulness (Avg) ↑ | 1.020 | 0.860 | 1.220 | 1.100 | 1.653 | 1.245 | 1.800 | 1.780 | 1.260 |
| Coherence (Avg) ↓ | 3.857 | 5.460 | 5.740 | 5.420 | 5.571 | 6.306 | 5.440 | 4.420 | 3.420 | |
| 1 sigma | Joyfulness (Avg) ↑ | 1.000 | 0.800 | 1.260 | 1.490 | 2.120 | 2.980 | 2.280 | 1.776 | 2.160 |
| Coherence (Avg) ↓ | 4.780 | 3.680 | 4.040 | 3.531 | 4.860 | 4.857 | 6.480 | 5.347 | 5.800 | |
| 2 sigma | Joyfulness (Avg) ↑ | 0.840 | 1.520 | 1.143 | 1.878 | 2.625 | 2.458 | 2.520 | 2.340 | 1.960 |
| Coherence (Avg) ↓ | 4.420 | 3.680 | 3.857 | 4.061 | 5.854 | 6.688 | 6.460 | 6.360 | 6.520 | |
| 3 sigma | Joyfulness (Avg) ↑ | 0.820 | 1.220 | 1.220 | 1.837 | 2.460 | 2.571 | 2.388 | 2.510 | 1.854 |
| Coherence (Avg) ↓ | 3.920 | 4.180 | 3.580 | 3.449 | 5.120 | 5.633 | 6.204 | 6.633 | 5.542 | |
| 4 sigma | Joyfulness (Avg) ↑ | 0.840 | 0.755 | 1.380 | 1.960 | 2.280 | 2.224 | 2.612 | 2.720 | 1.520 |
| Coherence (Avg) ↓ | 3.600 | 3.837 | 4.400 | 3.560 | 4.720 | 5.878 | 6.653 | 6.800 | 4.200 | |
| 5 sigma | Joyfulness (Avg) ↑ | 0.580 | 0.640 | 1.429 | 1.640 | 2.458 | 1.680 | 2.333 | 2.224 | 2.220 |
| Coherence (Avg) ↓ | 3.440 | 4.040 | 5.347 | 3.480 | 4.771 | 5.900 | 5.625 | 5.694 | 4.980 | |
| One linear | Joyfulness (Avg) ↑ | 0.840 | 1.245 | 1.520 | 2.000 | 2.292 | 2.580 | 3.020 | 2.480 | 2.080 |
| Coherence (Avg) ↓ | 4.360 | 3.347 | 4.380 | 4.640 | 5.208 | 6.020 | 5.918 | 6.780 | 6.340 | |
|
Note: A higher joyfulness score indicates a better steering effect. Coherence measures the repetitiveness and chaos in the generated sentences, with lower values being preferable. The best performance for each method is highlighted in bold within the table. |
||||||||||
- Conclusion
- GCS-sampled concept vectors can better balance steering performance and maintaining the fluency in natural language generation tasks.